Data Quality Dashboard
This guide provides a step by step walkthrough of a Data Quality Dashboard in Crysp IQ
Go to dev.cryspiq.com
1. Click "Data Quality"
Start by expanding the "Data Quality" menu
2. Click "Dashboards"
Navigate to "Dashboards"
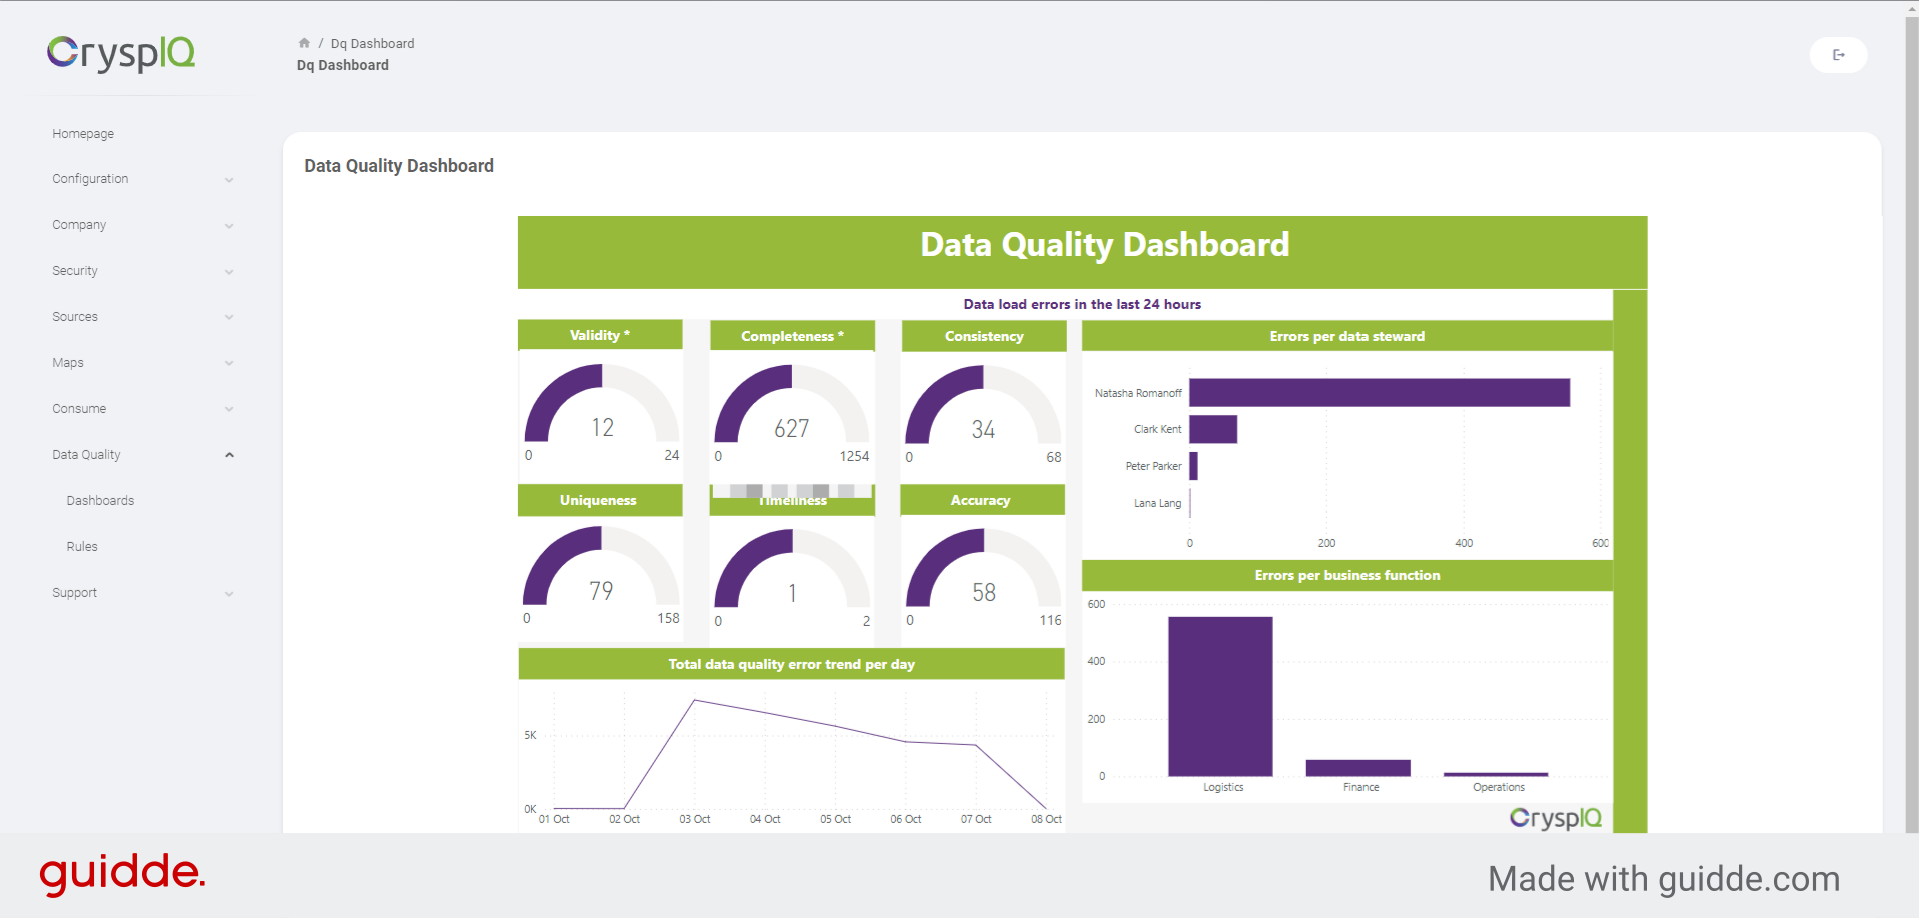
3. View the Data Quality Dashboard
The Data Quality dashboard is shown, with metrics populated directly from Crysp IQ based on the defined Data Quality rules. Data is shown per Data Quality dimension, including Validity, Completeness, Consistency, Uniqueness, Timeliness, and Accuracy. A trend is also shown with the number of Data Quality events per day. Charts also visualise the Data Quality errors per Data Steward and Business Function based on metadata stored in Crysp IQ.
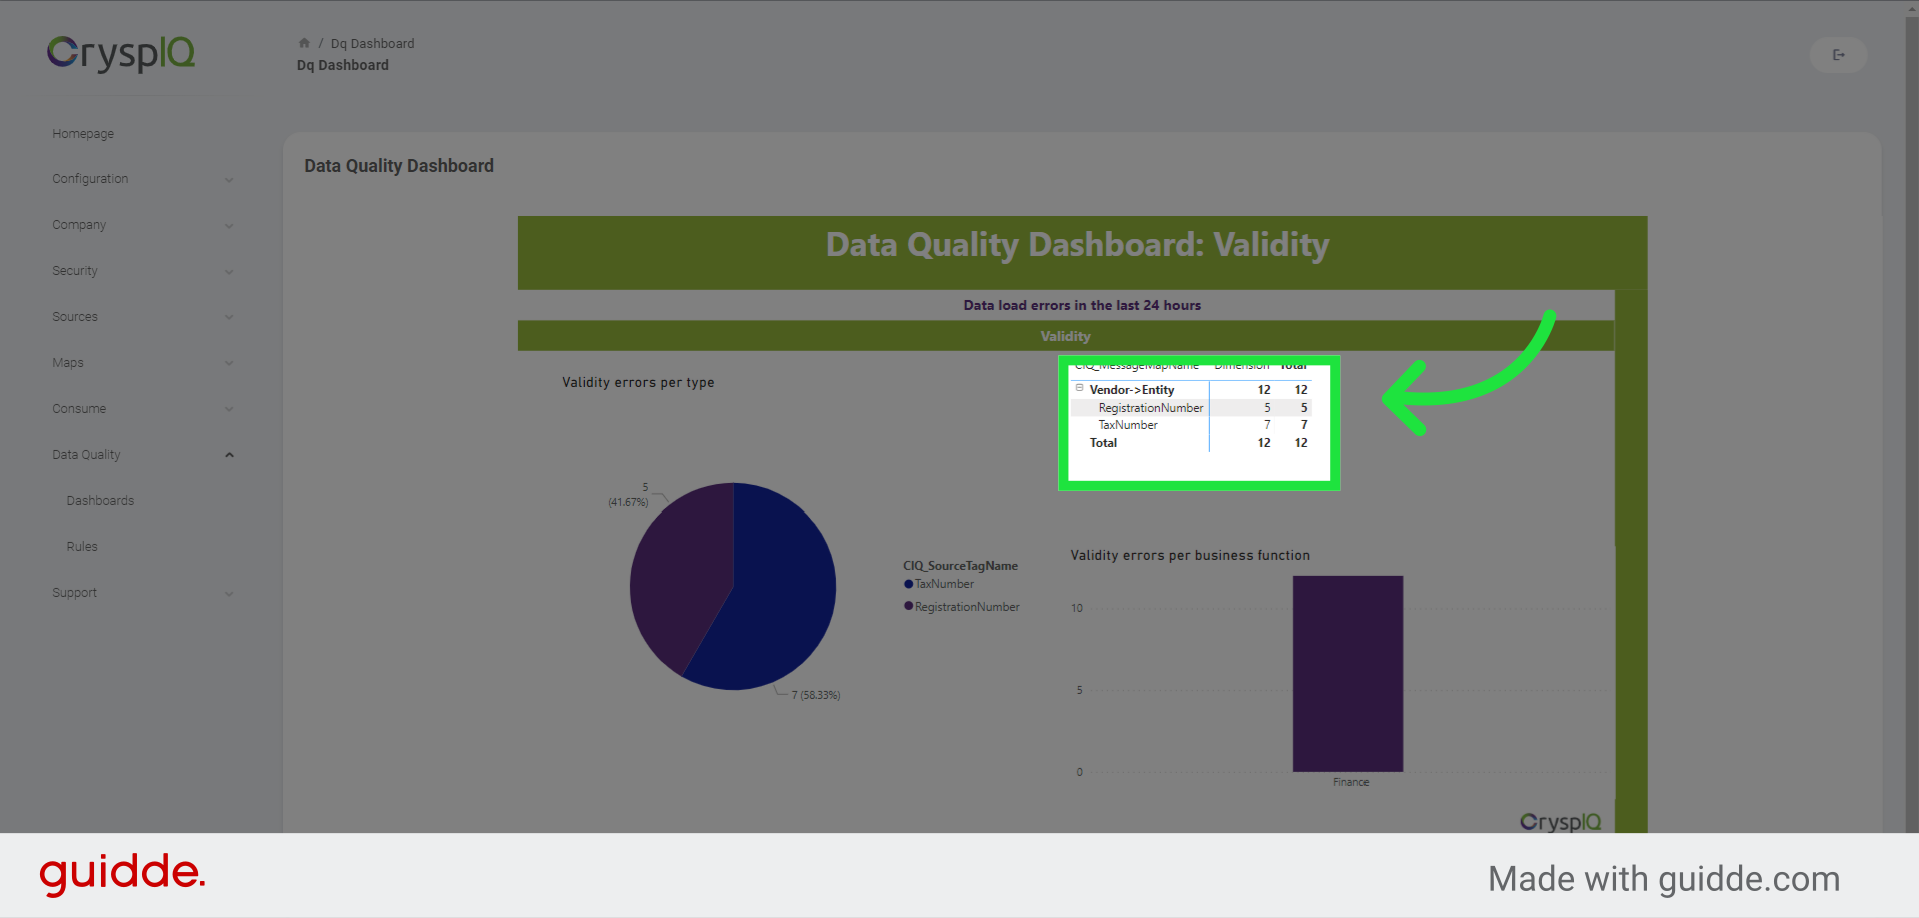
4. Drilldown reports
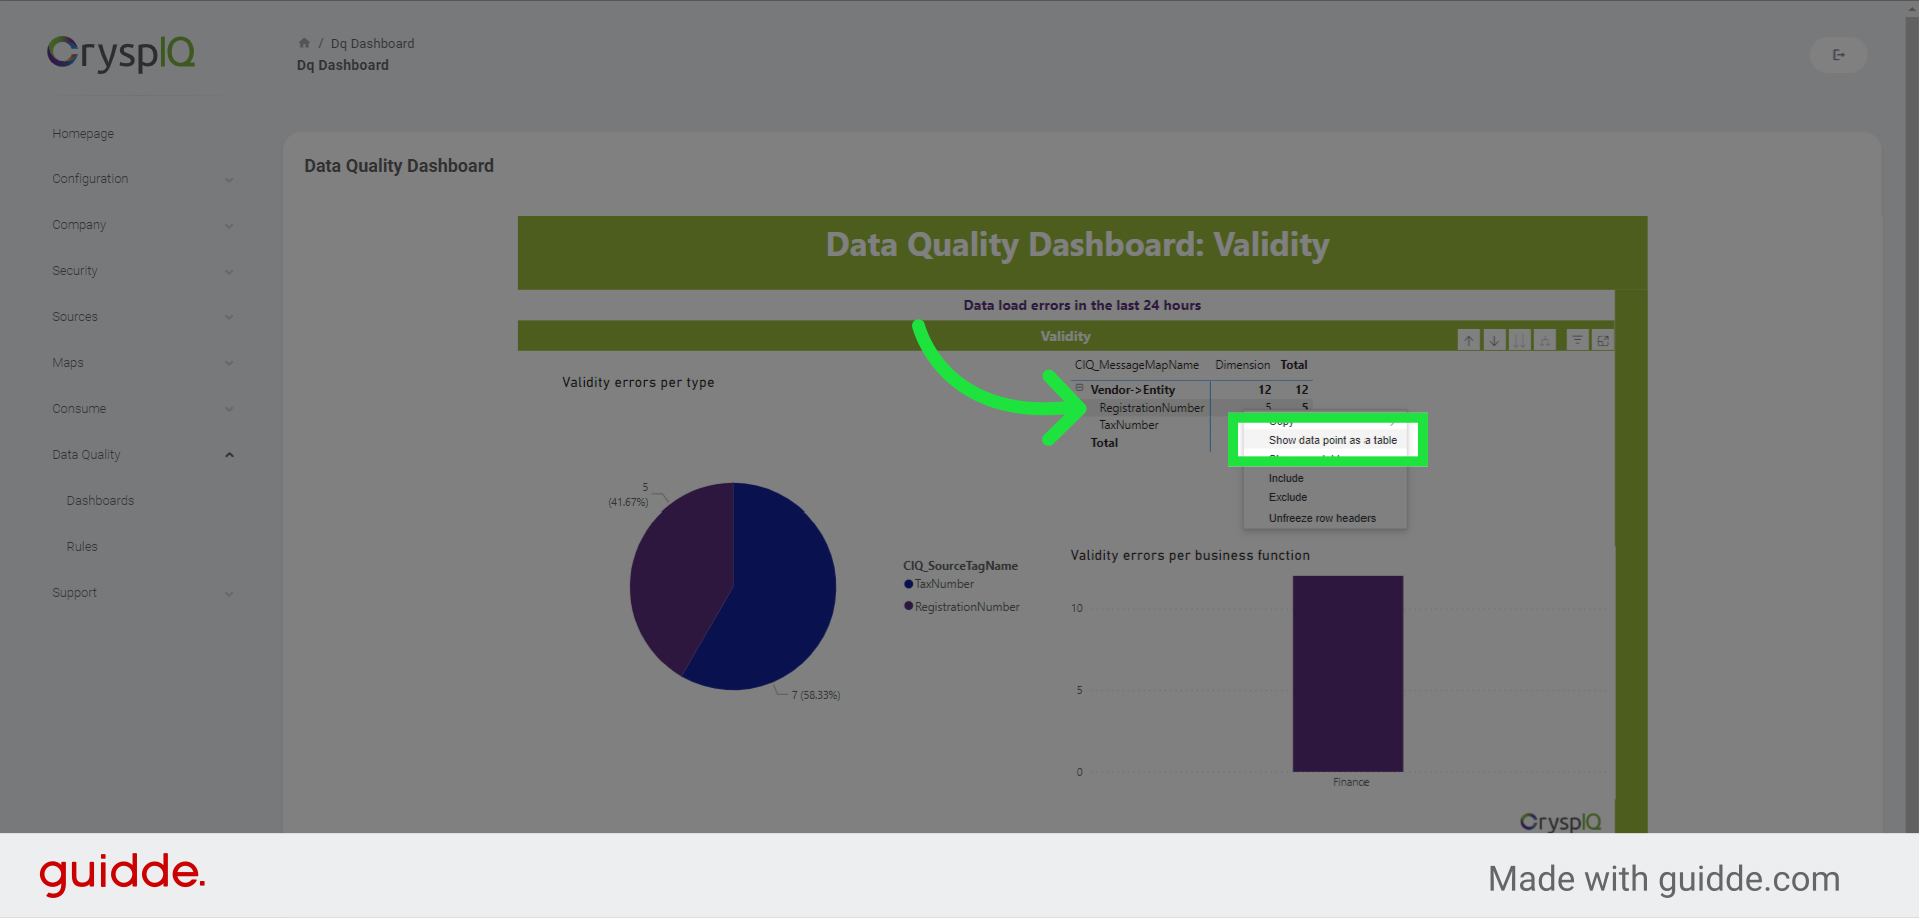
Drilldown reports show exactly for which business objects and contexts the errors occurred. In this example we can see that there were Data Quality errors in the entity context for the fields "RegistrationNumber" and "TaxNumber". The report shows the number of errors per attribute.
5. Click "Show data point as a table"
To show the detail for each error, right click on the number, and then select "Show data point as a table".
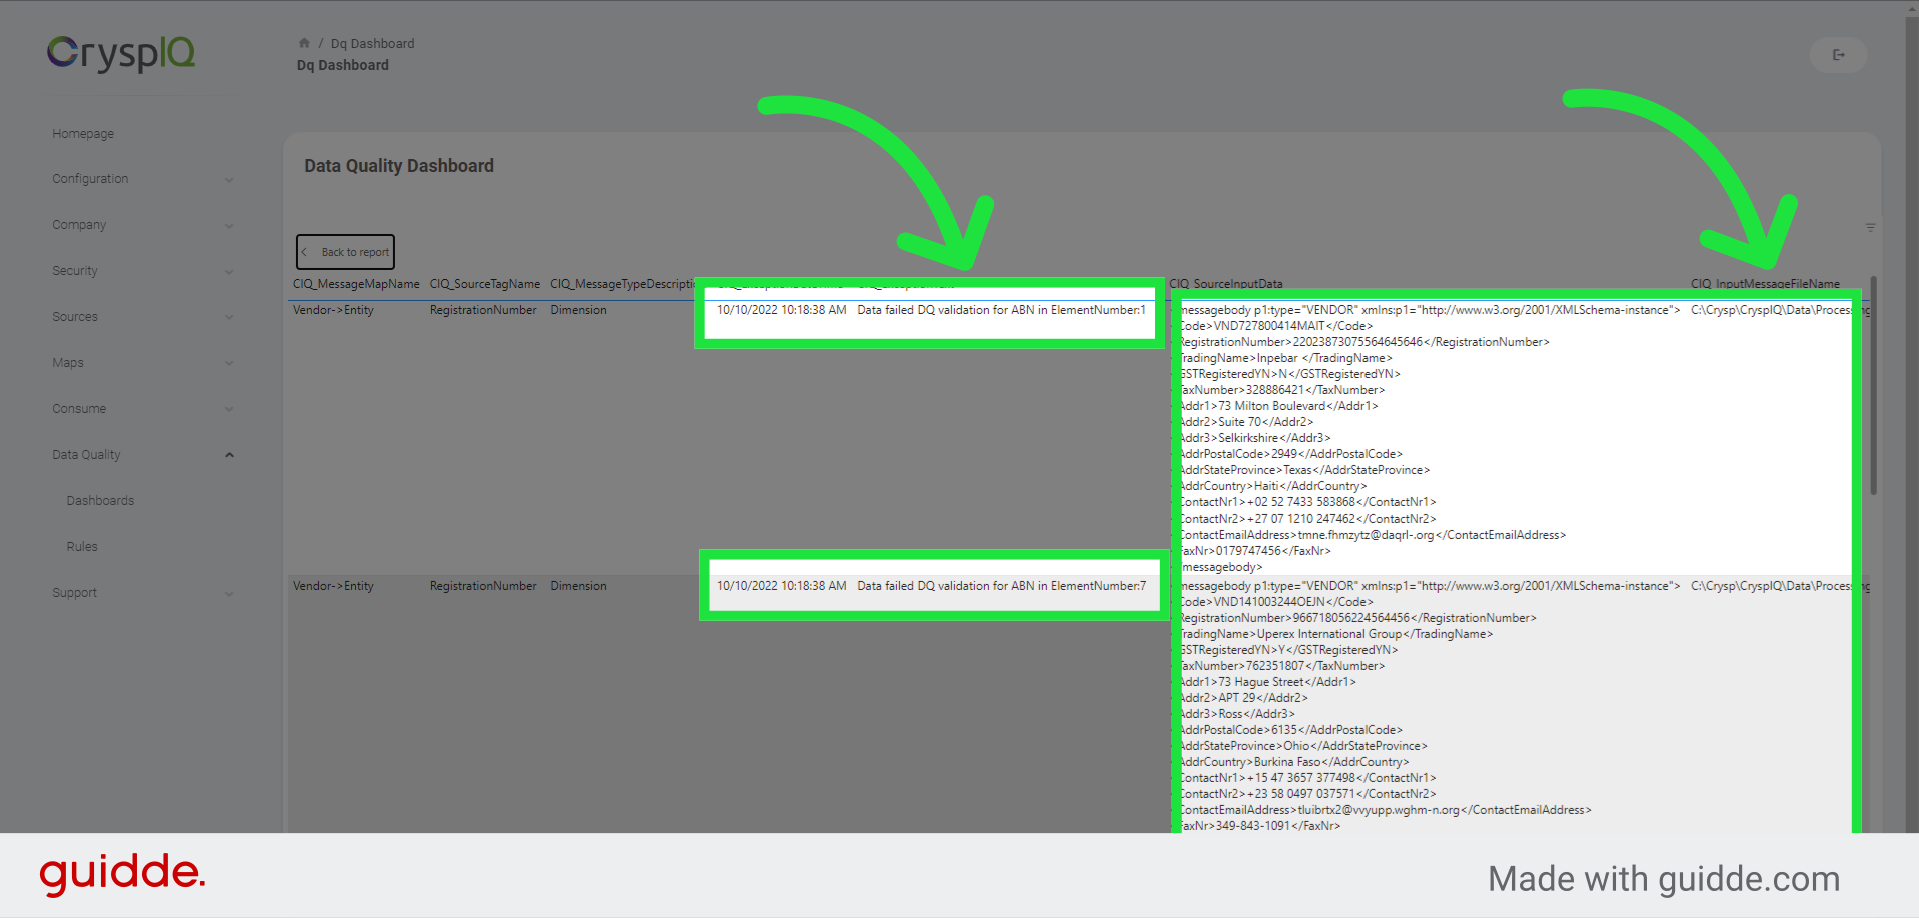
6. Row number and reason for issue
The table shows the exact exception text as well as the line or element number where the error occurred. The table also includes the output of the mapped data to easily identify where the problem lies.
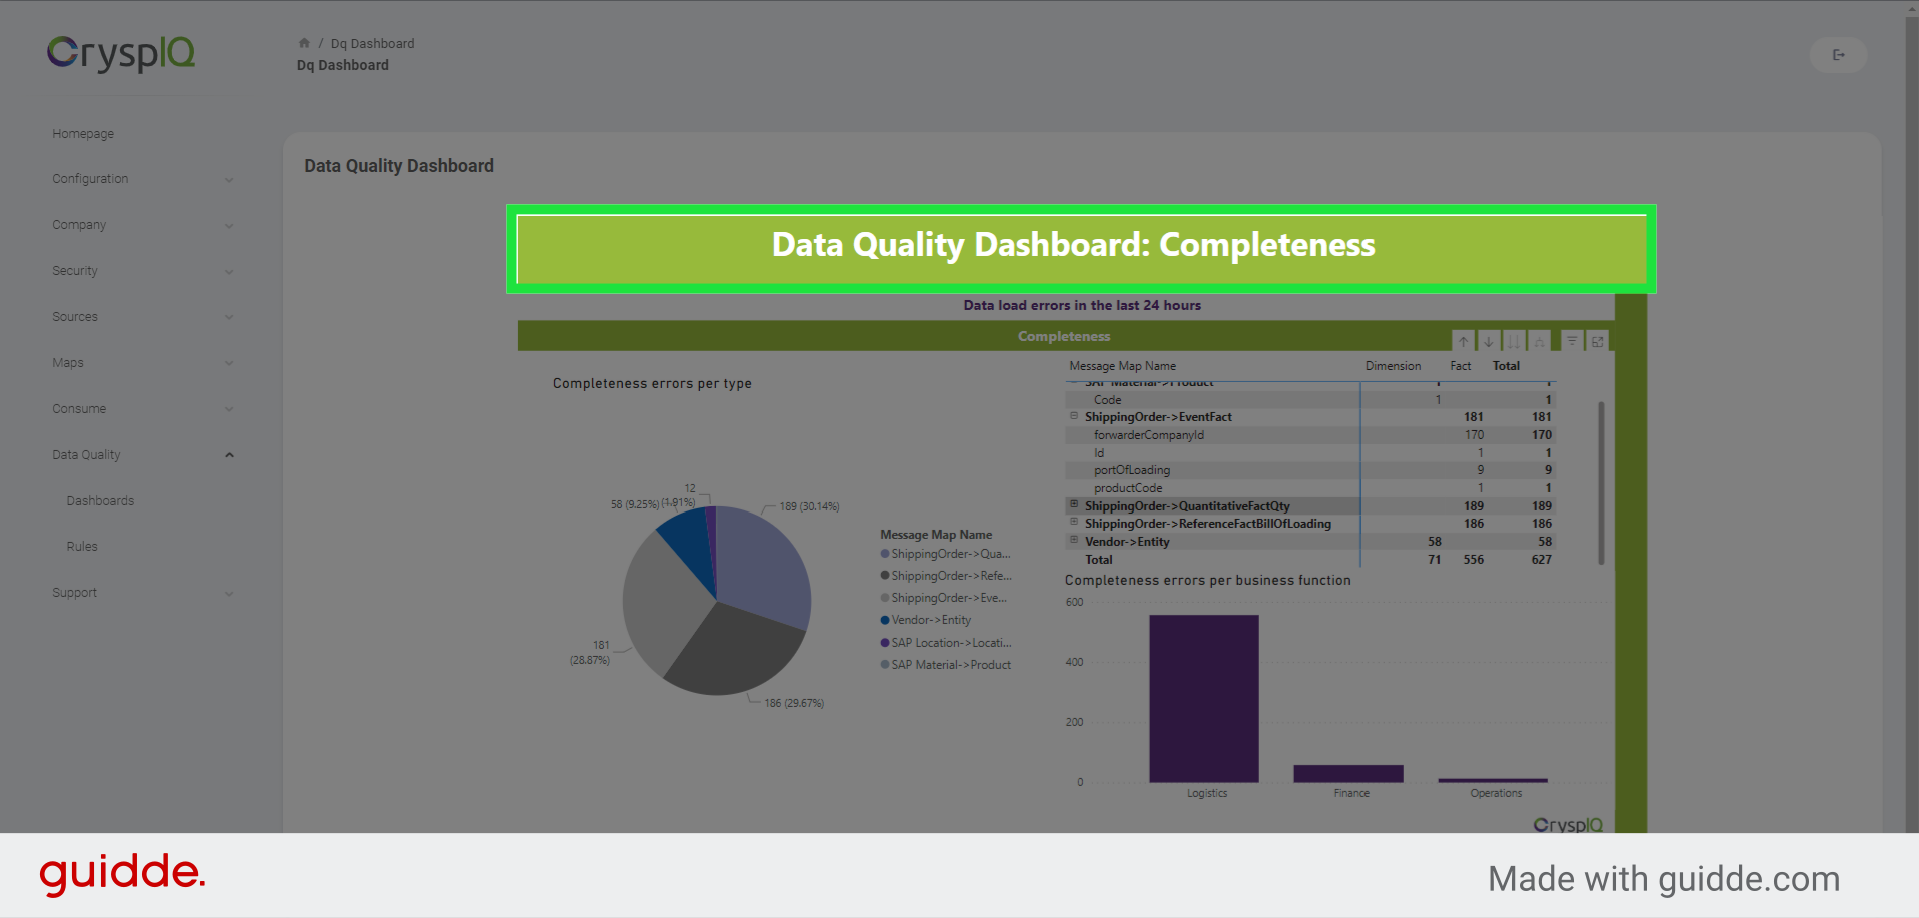
7. Drilldown reports per Data Quality Dimension
The drilldown reports are available per Data Quality Dimension. Where the previous report focussed on Validity, this report focusses on Completeness. The same drillthrough capability is possible to inspect the erroneous records.
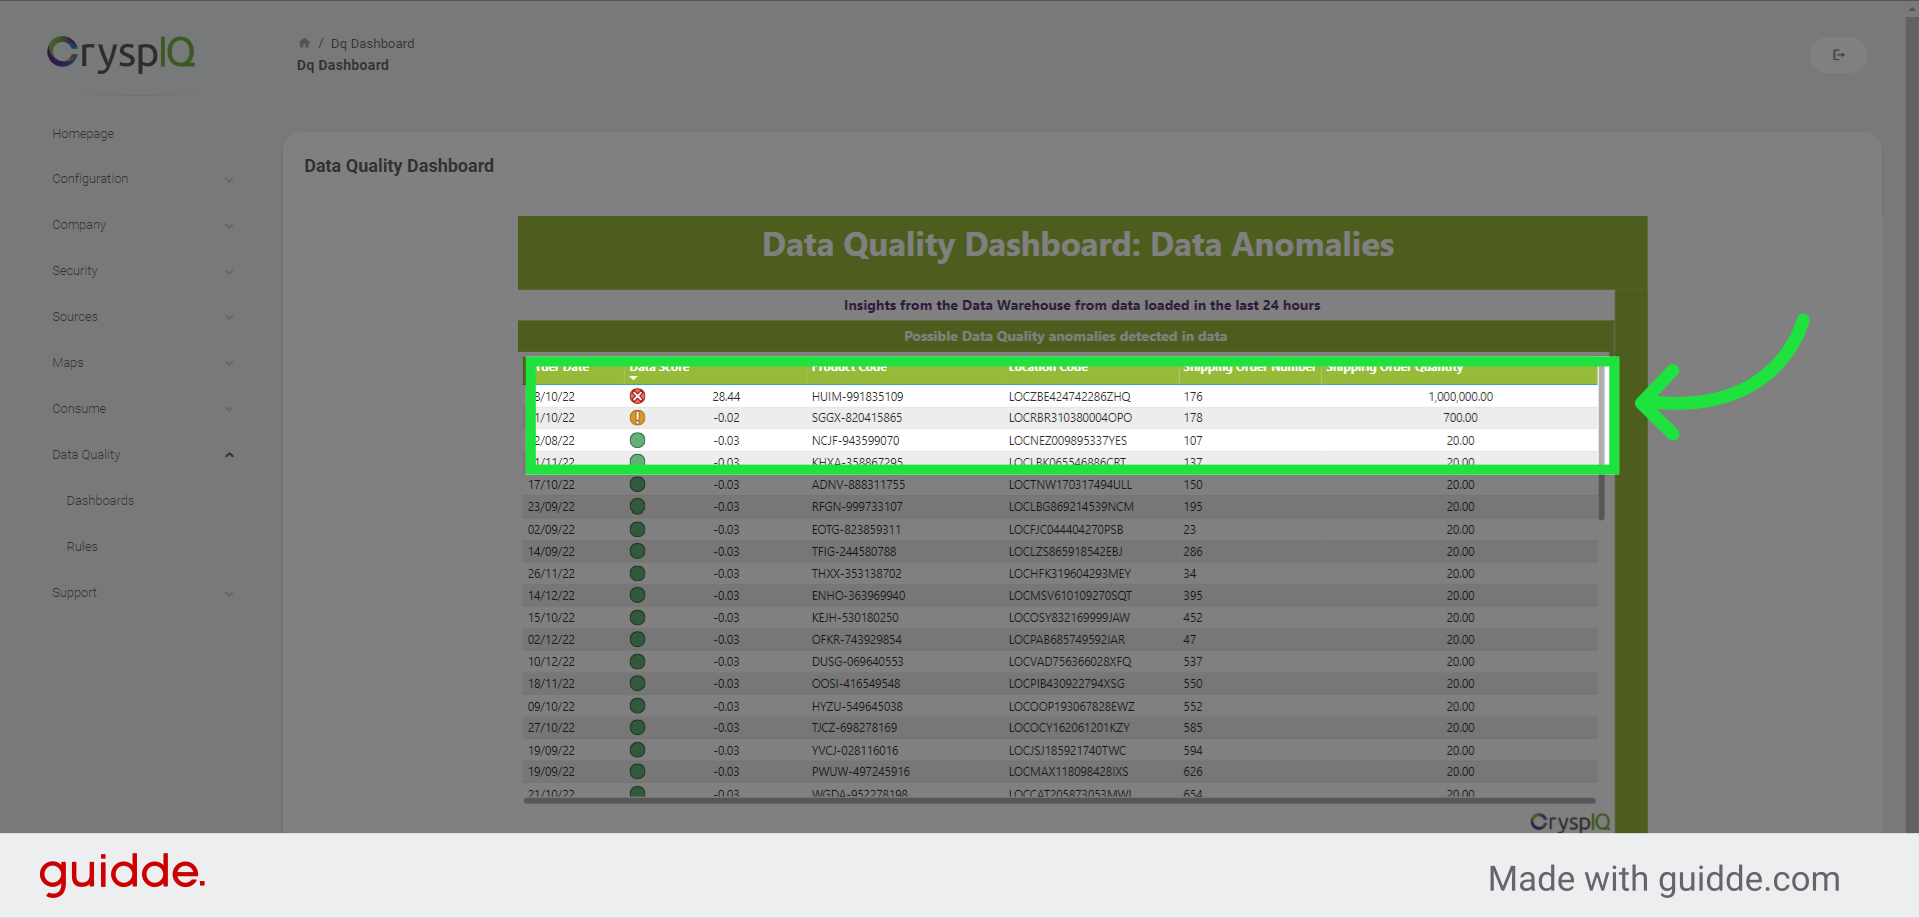
8. Detecting Data anomalies
Sometimes, data quality rules are not enough to ensure data purity. Users may enter incorrect numbers, or IOT devices may fail and generate incorrect readings. It is therefore necessary to implement anomaly detection for scenarios where this may happen. In this example we show shipping orders per day. The expected number of orders per day averages around 10 for the last two quarters. You'll see that the first two records are clearly anomalies with quantities of one million and 700 respectively.
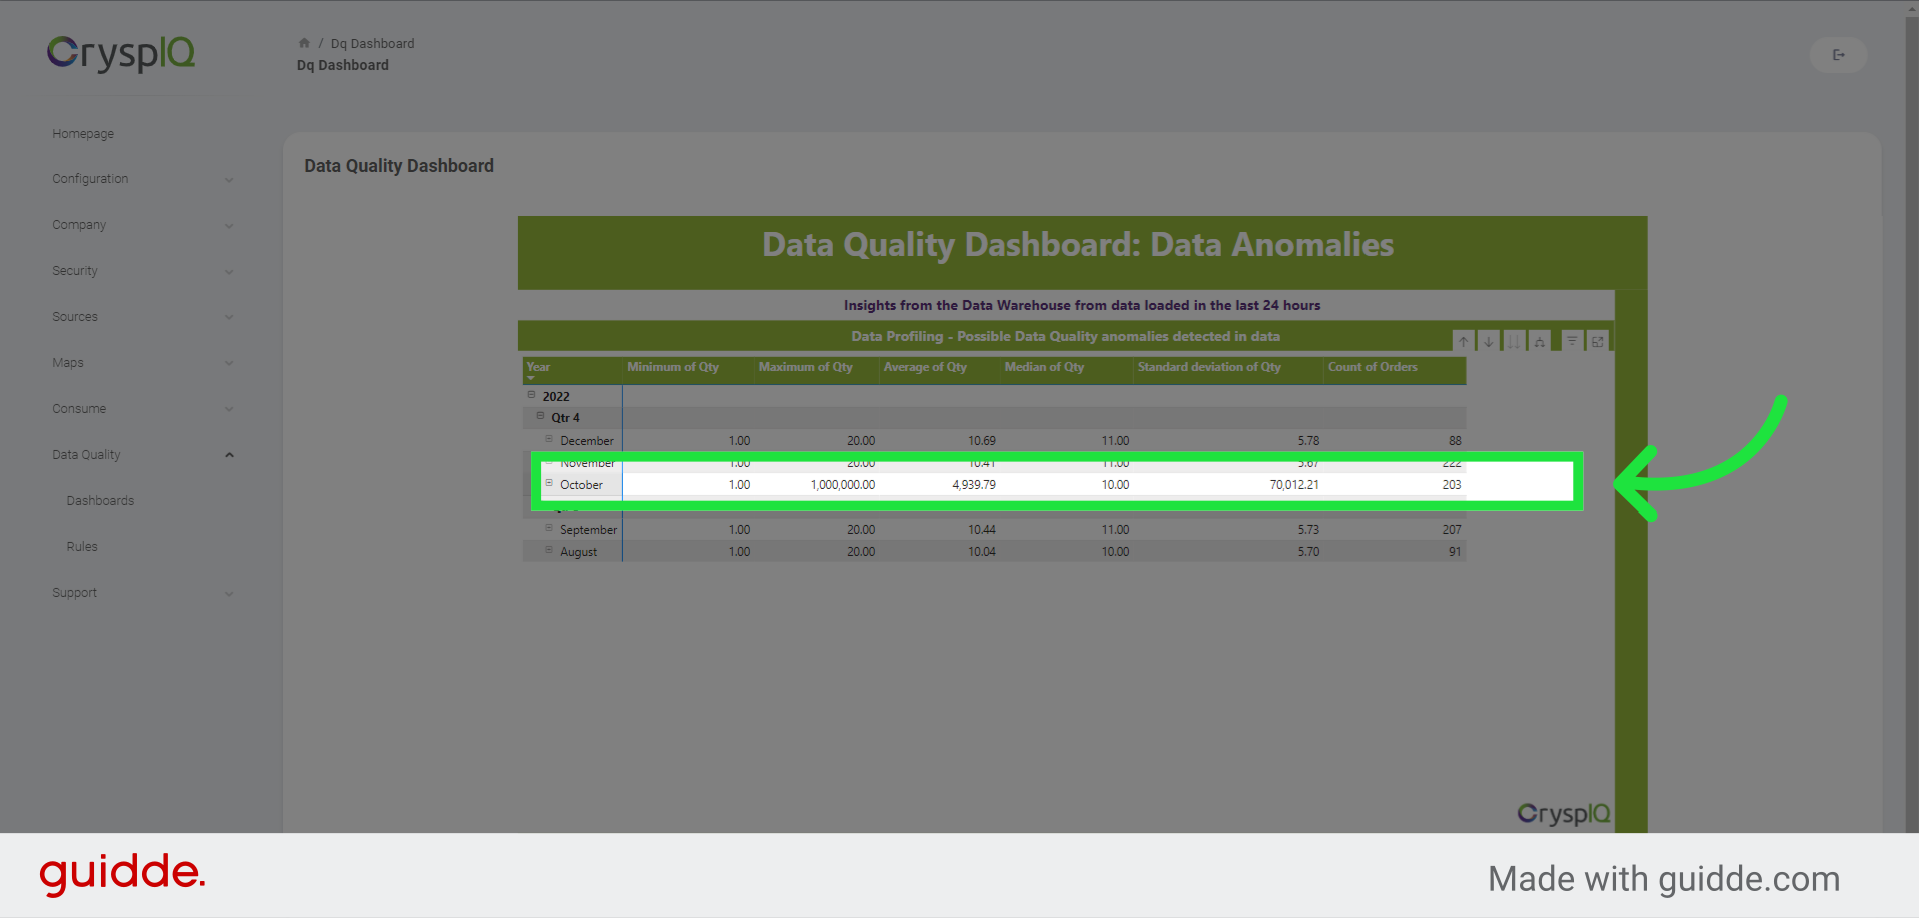
9. Drill down to see data profile
We are able to see the data profile for shipping orders on this page. It includes the minimum, maximum, average, median, standard deviation, and count of orders for each day, month and quarter. It is easy to see that there is a problem in October month of 2022.
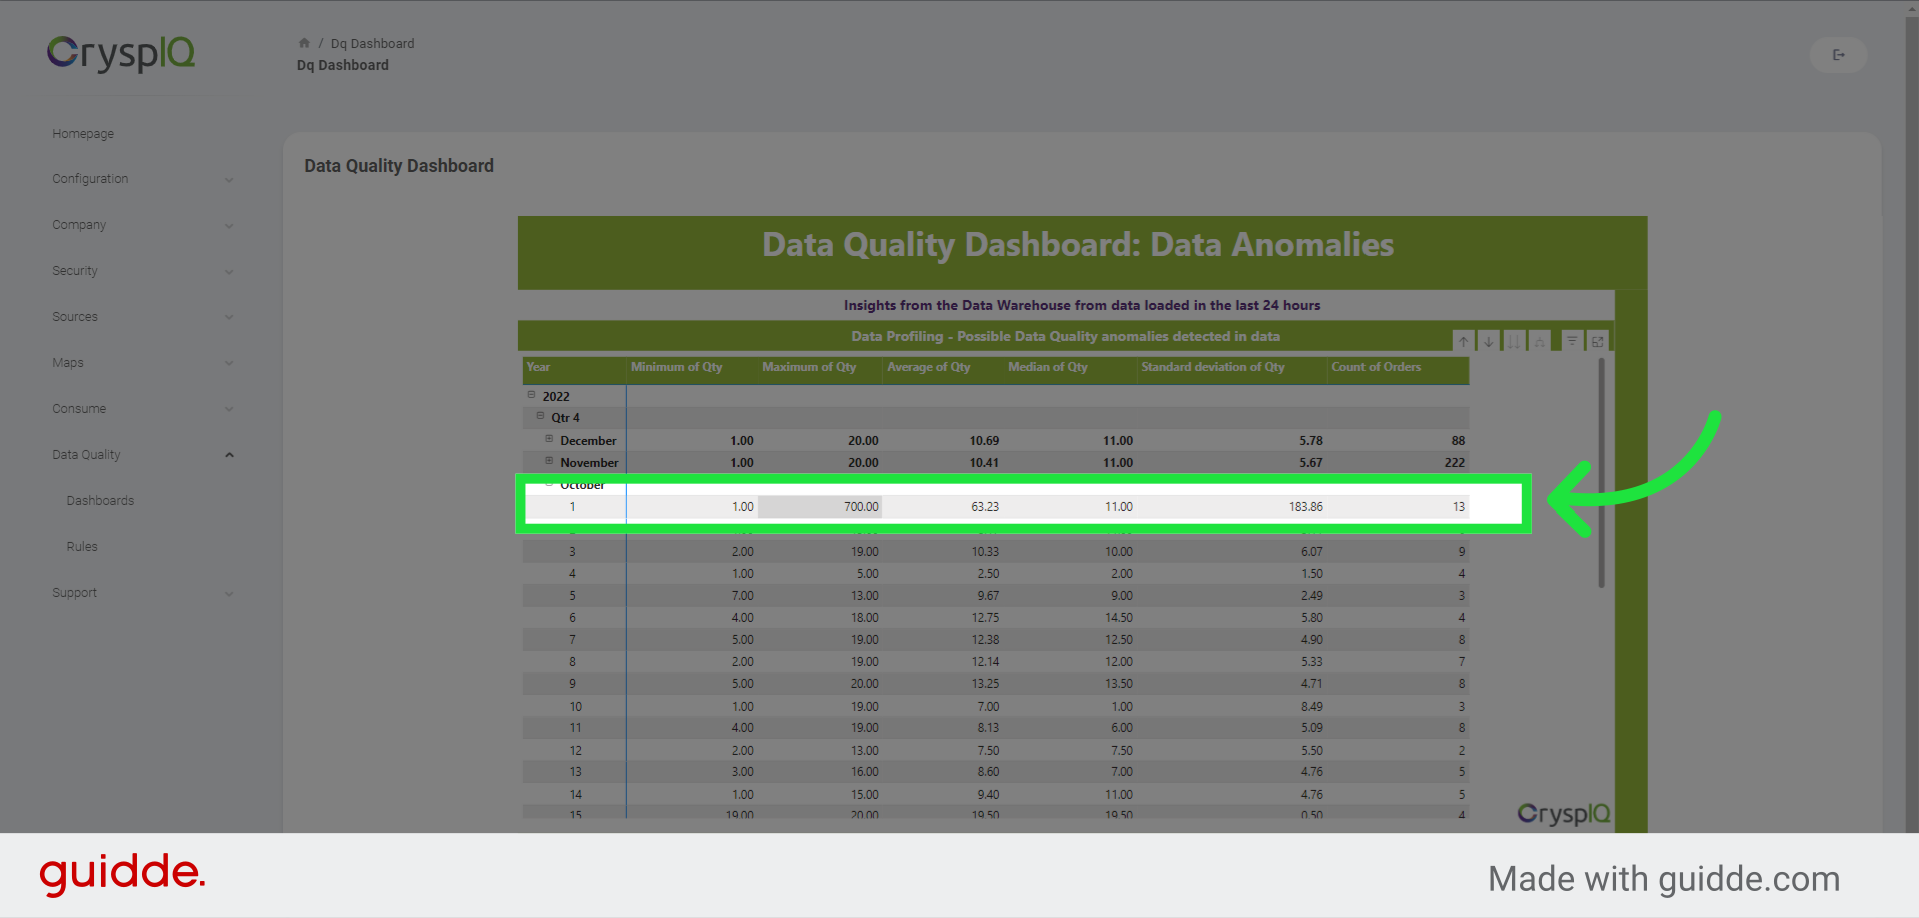
10. View more detail
We can go down to the lowest level of the data, on a daily level to identify the incorrect records.
This guide covered the steps to viewing and using the Data Quality Dashboard in Crysp IQ